Where’s my log
Overview
The more capable a tool is, the more possibilities you have to cause an error. Even so WEBCON BPS is doing a really great job in preventing these, there will be cases, where you will see an Unexpected error or similar. Especially if you are fiddling around with JavaScript or you communicate with external systems.
Depending on what caused this, more information can be retrieved within the browser directly or from log tables.
In case of diagnostic sessions / traces, you may find more information in the tables / log files.
Info: I’m using the log file output in the screenshots as it’s more readable. When I started this post I also thought, that there was a case where there would be no information in the tables, but this was not the case.
Log tables (important)
| Type | Database | Tables |
|---|---|---|
| Workflow history | Process database | WFActionExecutions AutomationSessionExecutions |
| Diagnostic session | Config database | AdminTraceSessions AdminTraceEvents |
| Other portal errors | Config database | AdminWFEventLogs |
| API logs | Config database | AdminAPILogs |
Heading explanation
I’ve listed all tables which contain some kind of log information. The process database contains log tables dedicated to the process databases. In addition, there are all log tables from the configuration database, even so they are not necessarily used. Moreover, some tables are more important than others for the daily business.
Therefore, I’m using the following convention:
Example AdminAPILogs C*P
C = Exist in configuration database
P = Exist in process database
* = Contains important information in the database.
Since the tables from the configuration are repeated in the process database, the missing P means, that I haven’t found data there / it’s not used.
Info: Process database is new name for the content database.
Info: This is just an overview of the log tables and my understanding how they are used. Feel free to correct me and/or provide more information.
AdminAPILogs C*P
I have no idea when data is stored in the config database and when in the content database. I have data in both databases, but the data in the process database is old, so it was probably switched to the config database in a new release.
One is for sure; it stores all calls to public API endpoints.
AdminTraceEvents C
Is used in combination with AdminTraceSessions.
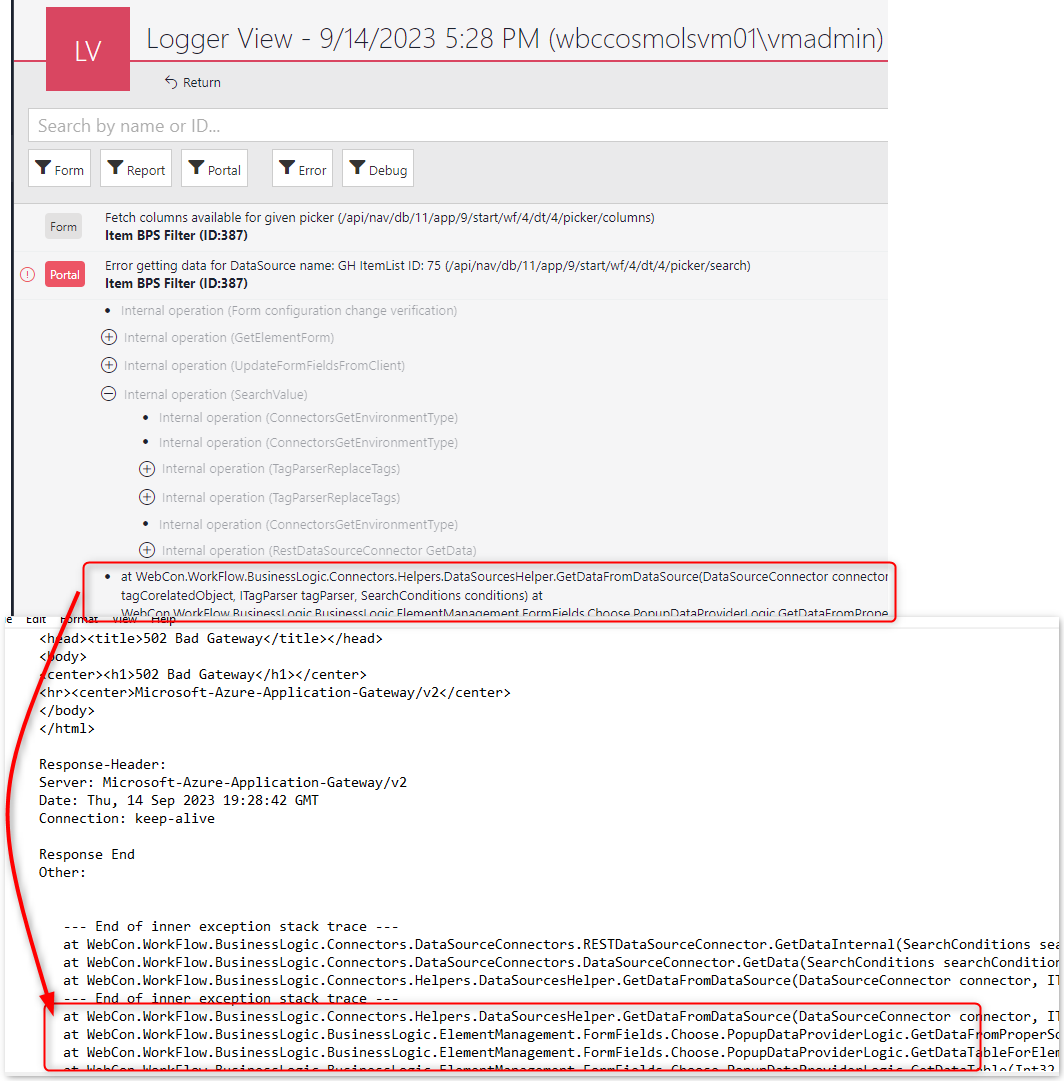
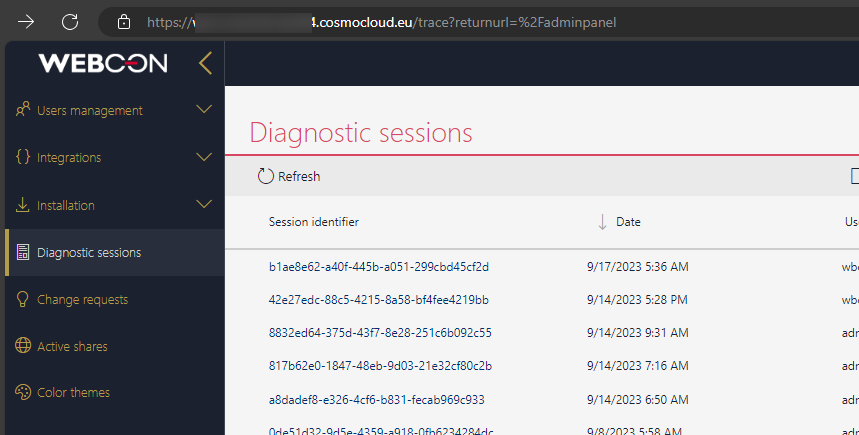
AdminTraceSessions C
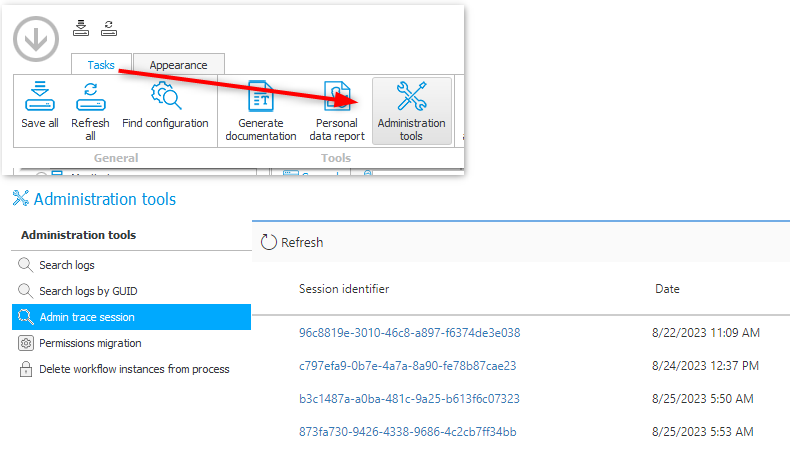
If a user activated Enable diagnostic mode any stored sessions can be found here. The details are stored in AdminTraceEvents. There’s no need to access the trace tables manually, good look in reading the data. You can access them via the administration in the portal or from the Designer Studio.
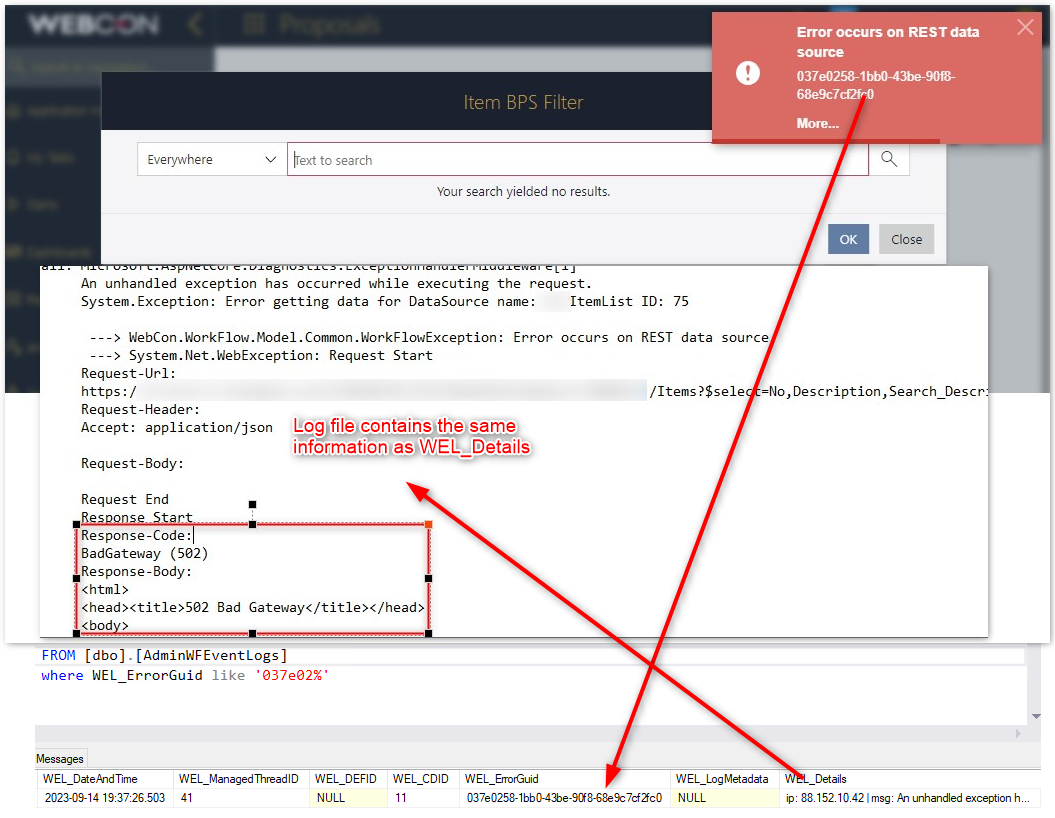
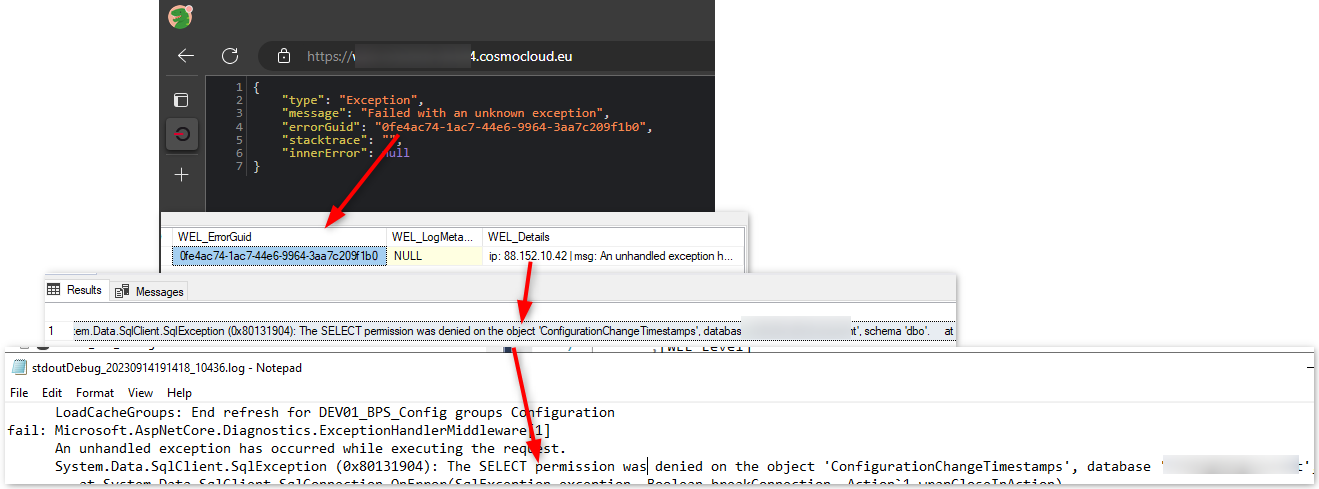
AdminWFEventLogs C*
If an error didn’t happen in the context of a path transition or you have an error guid, you will probably find it here.
WFActionExecutions knowledge base post
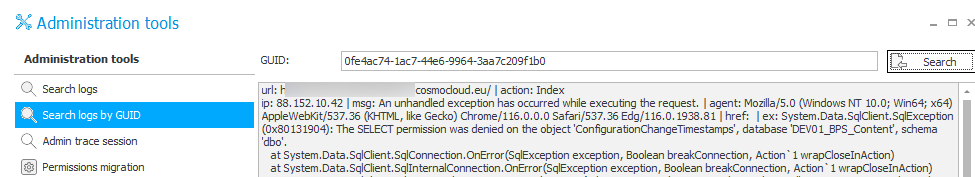
You can view the information of this table from the Administration tools in the Designer Studio by passing the error GUID.
Alternatively, you could add a data table in an own Log viewer process. This is way faster and you don’t need to enter the whole GUID, if you are currently debugging a problem.
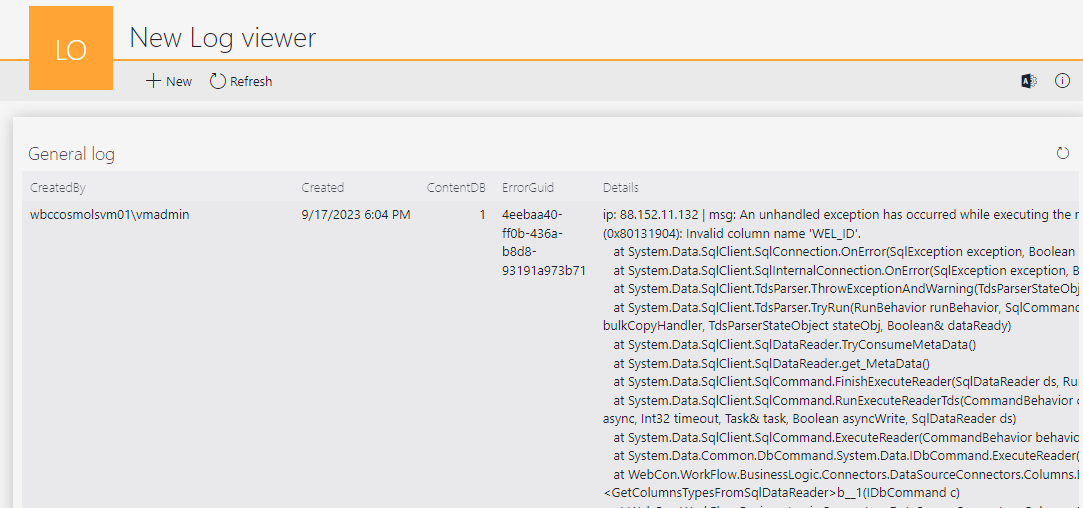
Log viewer process with a data table
SELECT Top 10 WEL_CreatedBy as CreatedBy, WEL_DateAndTime as Created ,WEL_CDID as ContentDB, WEL_ErrorGuid as ErrorGuid, WEL_Details as Details,  WEL_ID
from DEV01_BPS_Config.dbo.AdminWFEventLogs
order by WEL_ID desc
AutomationSessionExecutions P
Is used in combination with the WFActionExecutions table.
WFActionExecutions / WFLogs P
You can find the same information in a more readable way in the workflow history, at least after activating admin mode. ;) The view WFLogs is just ‘another name’ for the table WFActionExecutions.
WFActionExecutions knowledge base post
Displaying error details in browser
Thanks Marek , for providing this information.
While I developed for SharePoint one of the first things was to turn off remote errors on my dev environment. This resulted in displaying the error in the browser instead of showing just an error message.
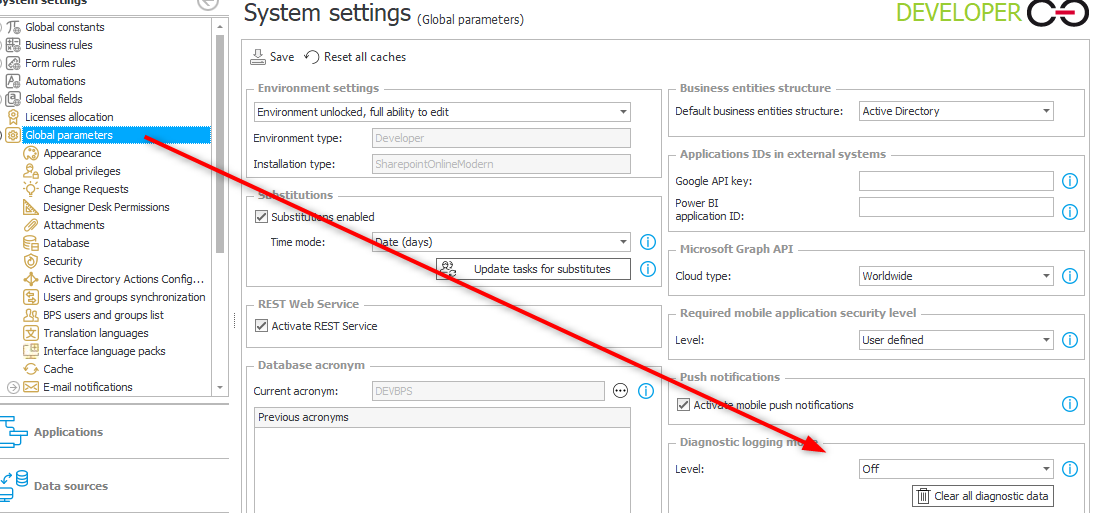
WEBCON BPS has a similar settings in the GlobalParameters of the Config database. The parameter is called ShowErrorDetails.
If you set this to 1 and recycle the application pool / execute iisreset, this may show you more error details in the browser.
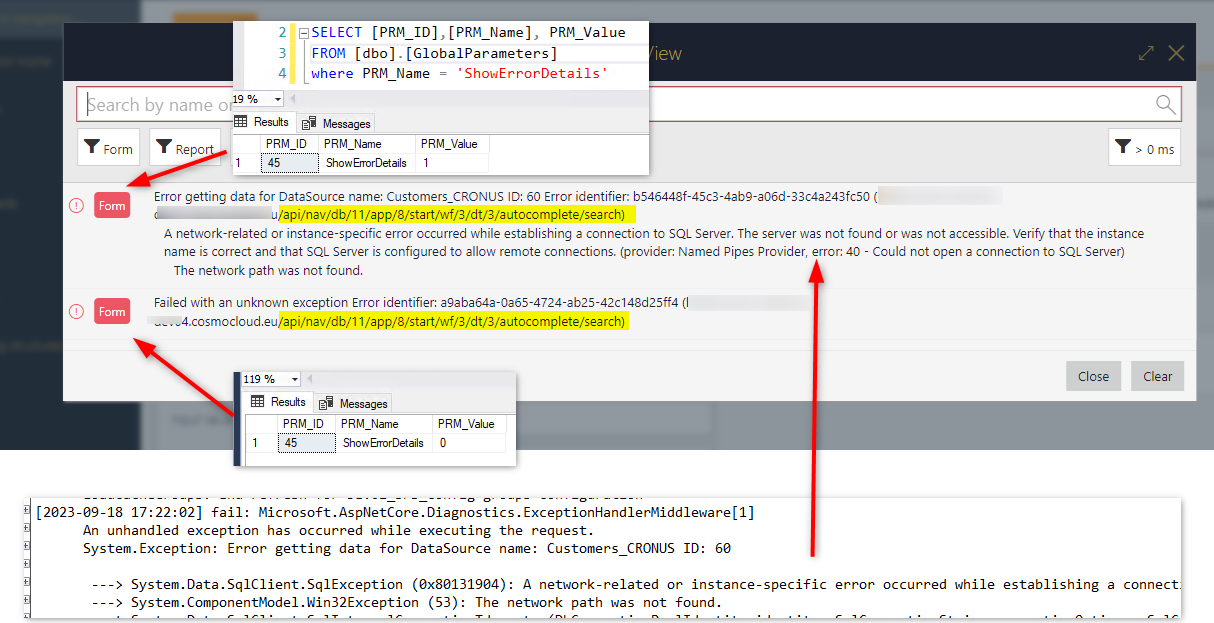
ShowErrorDetails can display more information in the browser.
Warning: This is set to false for a reason. An error message my contain compromising information about the environment. So, make sure on which system you really need to set this flag. Besides this technical reasons, users may get confused by too much information.
Log file
Sometimes though, you won’t find a hint anywhere except in the log file. At least this was my starting point for this post. While I dug deeper I forgot what information I didn’t find in the table. Nevertheless, the following I will describe a few configuration settings. You may have to redo these settings after an updated of the WEBCON BPS version. I’m not sure about it.
You will find the web.config and appsettings.user.json in the WEBCON BPS Portal folder. If you don’t know where it is open IIS click on the website and click the Explore action.
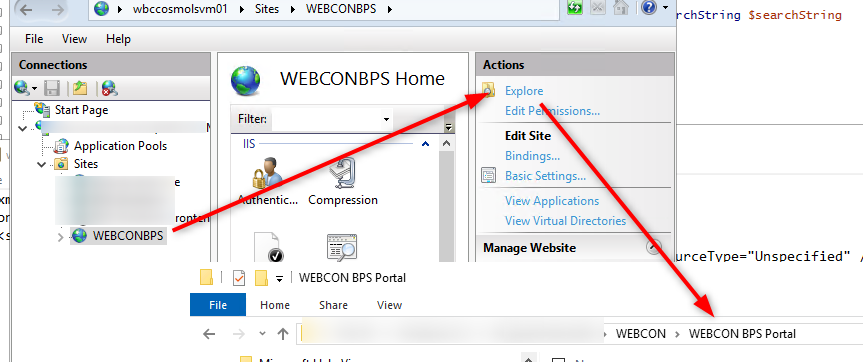
Explore.
Log folder
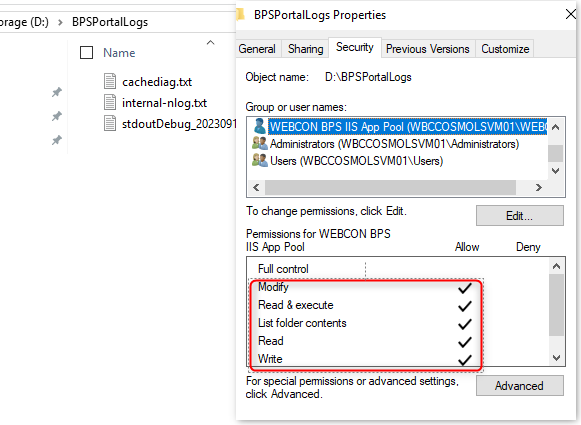
As a precaution, create a target log folder outside of the BPS Portal folder which is not on the windows partition. In addition, grant the application pool user modify permissions for it. Otherwise the files won’t be created.
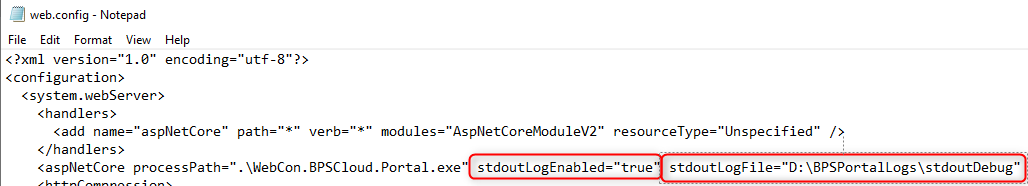
web.config
Make sure that the stdoutLogEnabled property is true and the stdoutLogFile points to your log folder.
You can find more information in Microsoft Learn Log creation and redirection.
appsettings.user.json
Here you need to move two log files:
- Internal log file of NLog
This will contain (error) information when nLog is started/activated. - Cachediagnostics
Some information about the cache.
Make sure to use \\ and not a single ‘' in the file paths.
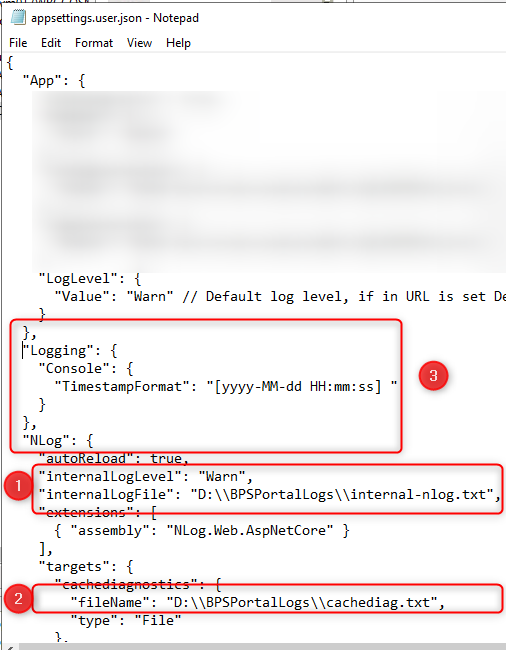
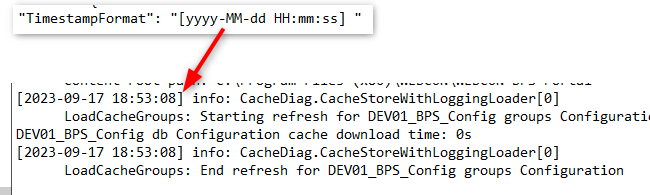
Number 3. is an addition which is not part of the default configuration. This adds a timestamp to the output in the standard out log file. You can find more information in Microsoft Learn Log creation and redirection.
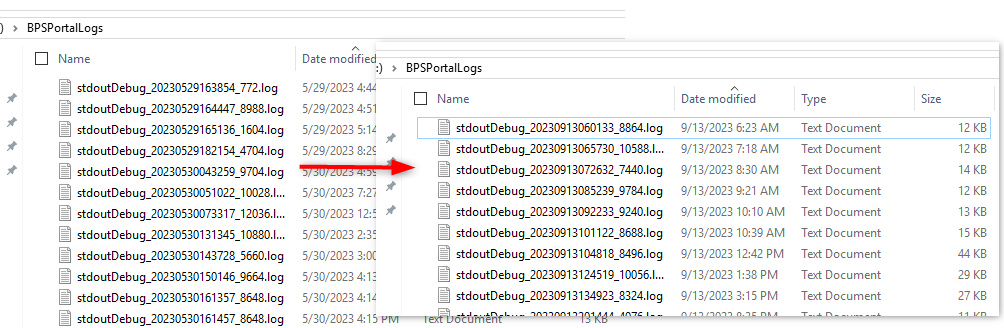
Log file cleanup
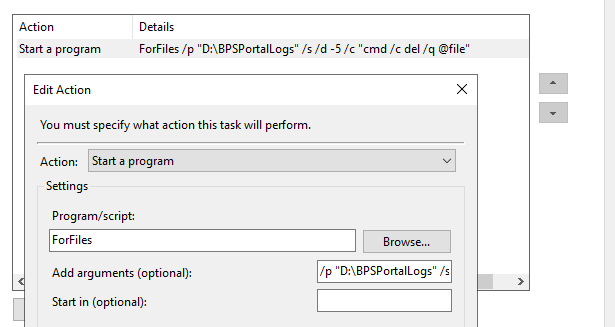
If you have read up about the standard out log file, you noticed, that there’s neither a size limit nor an automatic cleanup. Therefore, we need to take care of it ourselves. You can achieve this by creating a scheduled task with the below command. This will remove files older than 4 days.
ForFiles /p "D:\BPSPortalLogs" /s /d -5 /c "cmd /c del /q @file"
More information Microsoft Learn forFiles
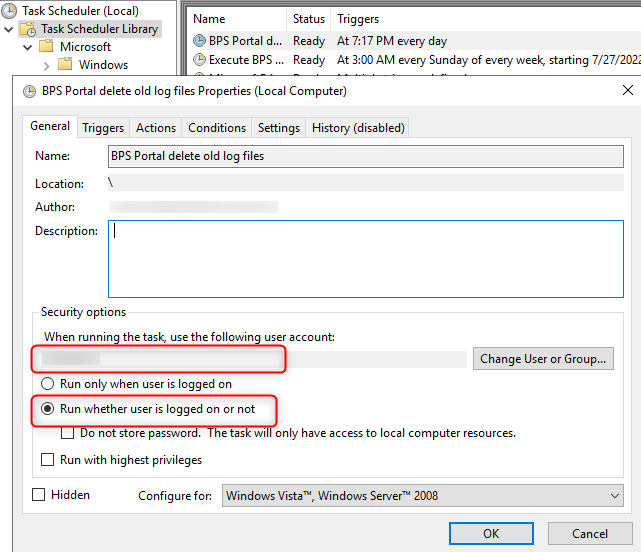
Make sure that the task executing user has write permissions to the folder, and that the task is executed whether the user is logged in or not.
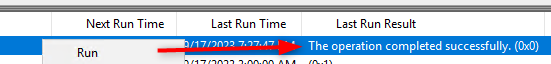
Execute a test run via the context menu. The result should be 0x0. If it is 0x1 there’s some error in the configuration / permissions.
Further debugging information
I haven’t found a log information which contained the request when testing a REST data source from the Designer Studio. Therefore, these two posts are still a valid option.
If you have problems with a SQL command execution, and you don’t find it in the diagnostic session, you could resort to the SQL profiler:
SQL profiler example
Less important log tables
AdminDBMigrationLogs C
Used during upgrades of WEBCON BPS.
AdminDBScriptInfos CP
Used during upgrades of WEBCON BPS.
AdminDebugLogs P
Debugging needs to be activated and be sure to deactivate it. It will quickly bloat the database and therefore the hard drive.
AdminFileProcessingLogs P
Probably used in context with hot folders.
AdminHotMailboxLogs P
Probably used in context with hot mailboxes.
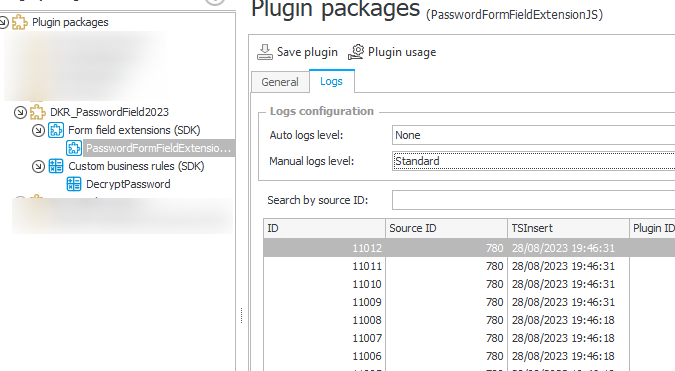
AdminPluginLogs P
You can view the log from the Designer Studio, so there’s no need to access this table.
Make sure you configured the logging for the plugin.
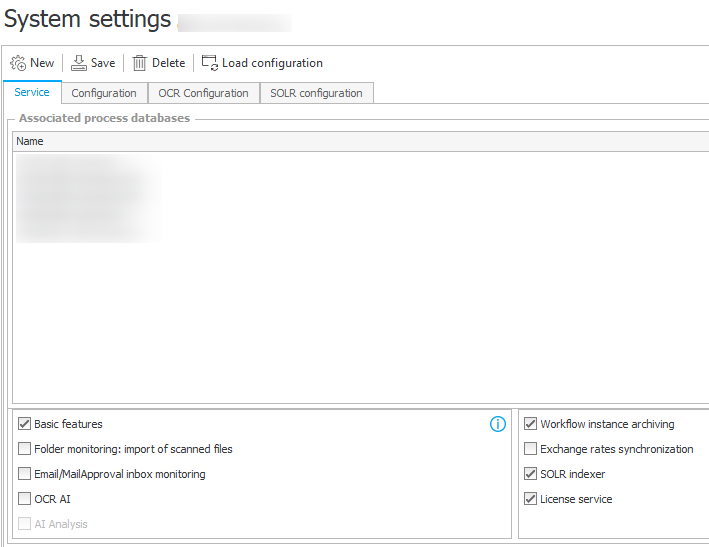
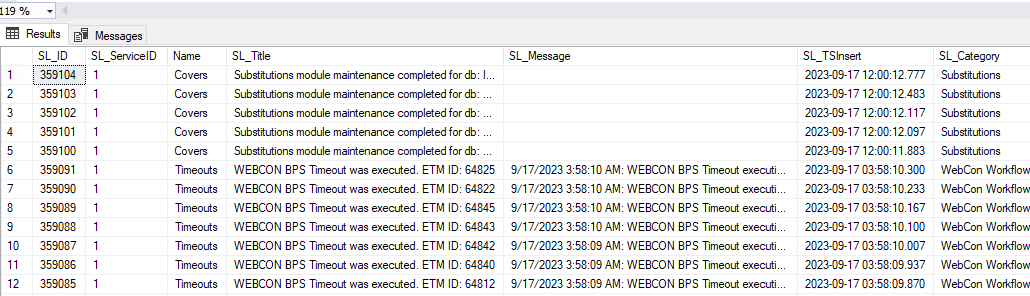
AdminServiceLogs C
Log information about the roles which have been taken over by a service. In a single environment all activated roles will be running on same service/machine.
This will give you a result with the names of the roles.
SELECT TOP (100) [SL_ID]
      ,[SL_ServiceID]
      , DicRoles.Name
      ,[SL_Title]
      ,[SL_Message]
      ,[SL_TSInsert]
      ,[SL_Category]
      ,[SL_Status]
      ,[SL_ContentDbId]
  FROM [dbo].[AdminServiceLogs] join DicRoles on SL_Role = DicRoles.TypeID
  order by SL_Id desc
Comments