Custom Gantt chart and the dashboard filter widget
Overview
After finalizing my last post Custom Gantt chart on a dashboard I wanted to add some filtering to it. While I could have added some custom filters, I was wondering, whether I can make use of the new filter widget.

This would provide the following benefits:
- Everyone is free to define the filters they want
- There’s no break in the user experience
- All elements on the dashboard using the same data set will use the same information
- Most importantly, I don’t have to create anything fancy for the filtering
Even so I only found a hacky approach I think it’s worth it. :)
Implementation
The implementation is almost the same as in the first post. Therefore, I will focus on the differences:
These are the new/different steps.
- Dashboard preparation
- A dataset instead of the report
- A filter widget using the dataset
- A report widget using the dataset
- A HTML code widget to configure the Gantt chart with a little change to the endpoint configuration
- Another HTML code widget for the Gantt logic
- A HTML code widget for the modal dashboard
- The client must be able to access
https://cdn.jsdelivr.net/npm/frappe-gantt/dist
I’ve linked the explanations of the steps which haven’t changed to keep this post focused on the changes.
Remark: The Gantt logic file is not the same as in the last post The way the data is retrieved is to different. At the same time, I do believe that the other version won’t be used anyway.
Dashboard preparation
Dataset creation
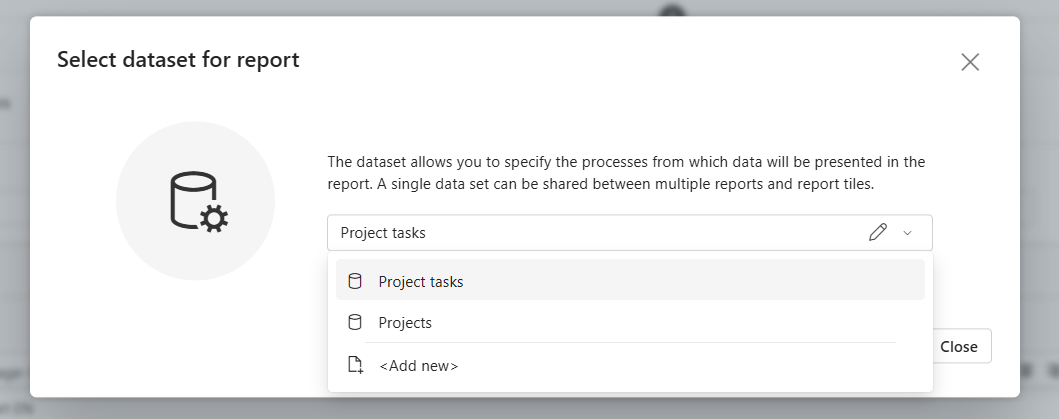
For whatever reason, you cannot start creating a new dataset on its own. You need to add another element which requires a dataset, so that you can choose to create a new one. Since we need a report anyway, I would add a report widget and select Add new:
The Gantt chart will require the following columns:
- The workflow instance id
- Start date
- End date
- A title
- It can optionally provide the following information
- Parent element
This can be the default parent workflow id, but it could also be any other column/calculated field with a workflow instance id. I saved the parent element in a choose field.

- Progress
An integer value between 0 and 100
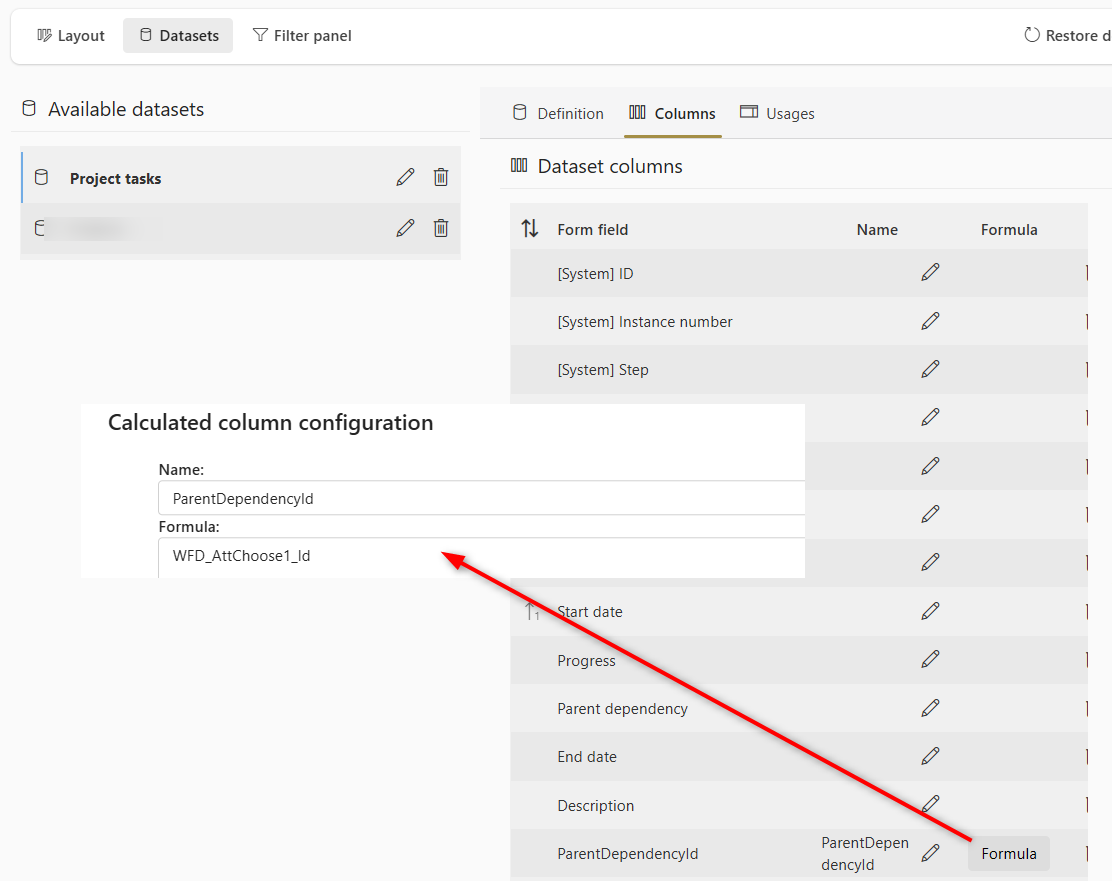
Report widget creation
The report will have to display all the necessary column defined in the dashboard.

Filter widget creation
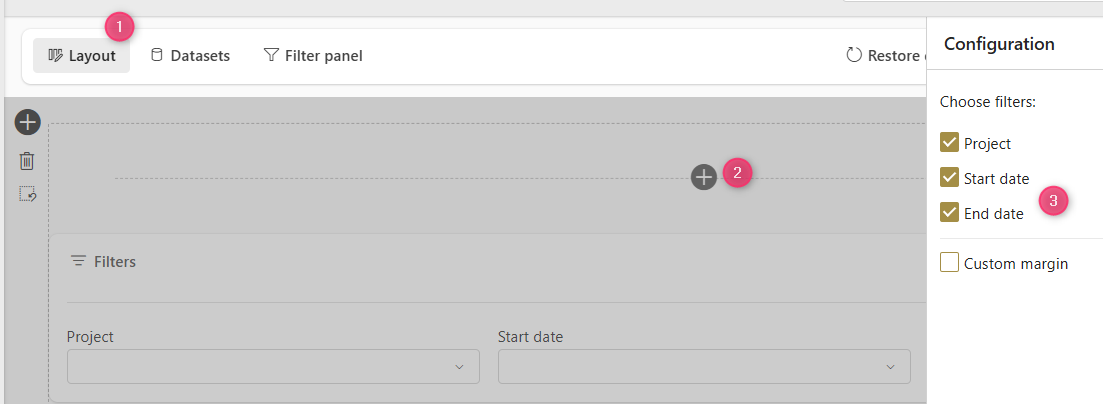
After the dataset has been created you can define the available filters. You will need to switch the view of the dashboard to the Filter panel (1). There you can add the columns of the dataset you want to provide as filters. If you are using a choose field, you can select which Filter value source is used (2). There’s a really long explanation. In gist the Report data selection will limit the filter options to those, which have been used/stored in the WFElements table. The other one will allow the selection of all possible values. Since we are not in a form, we have no data context so any defined filters on the field are ignored.

Afterwards you can head back to the Layout (1), add the filter widget (2) and select the filters (3).
HTML code Gantt logic
You can simply copy the frappe-gantt-filter-widget.html file to an HTML code widget.
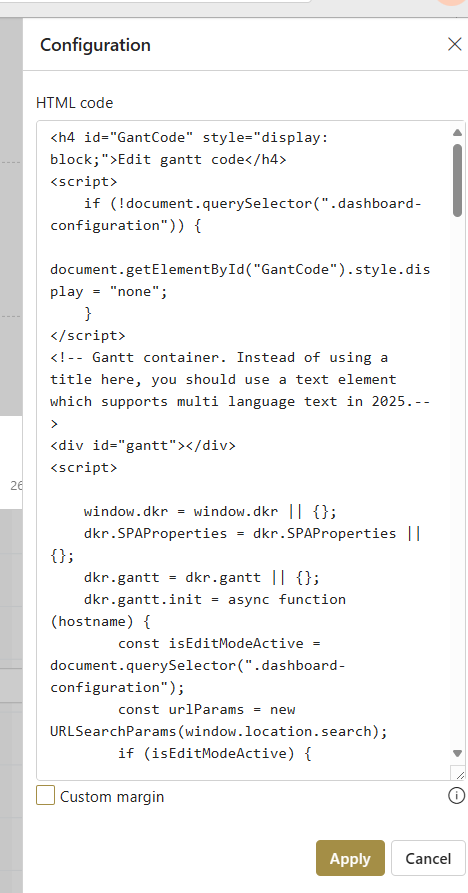
HTML codewidget.
Configuration
Endpoint definition
We still need to define the endpoint with the report id, but this time we cannot copy the report id from the URL like in the first post:
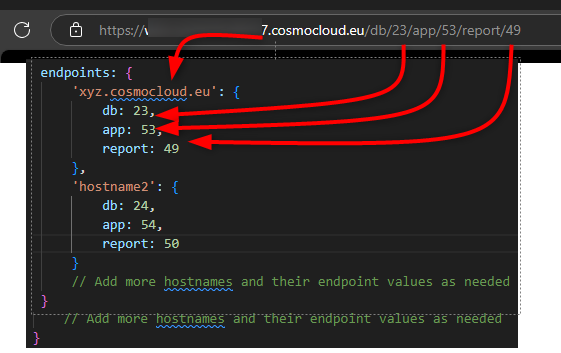
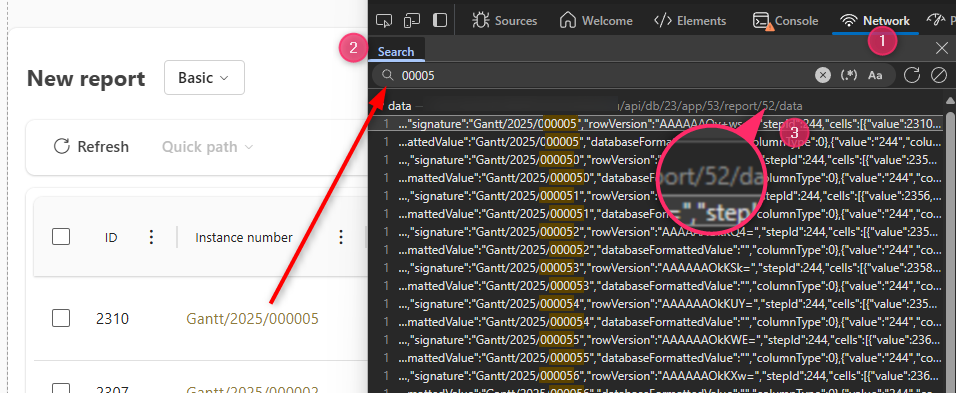
Instead, we need to open the developer tools.
- Display the Network tab and refresh the page
- Search for a value from the report.
- Get the report id from the data element
Hide report on the dashboard
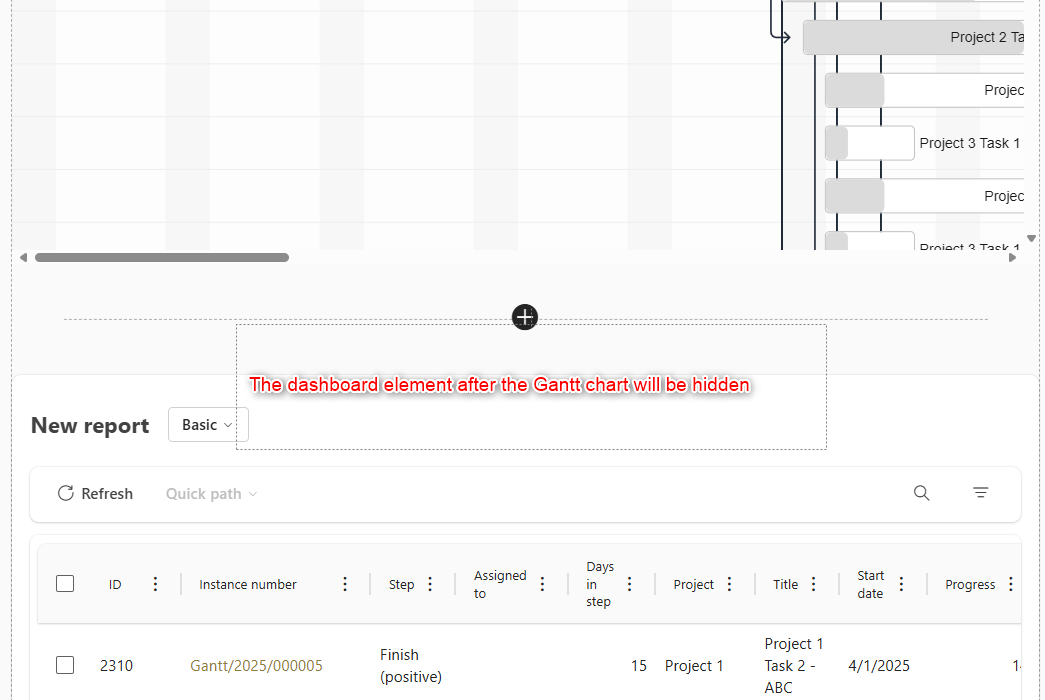
I’ve added a new configuration option
- hideReportOnDashboard
The default value istrueand it defines, whether the report should be hidden on the dashboard. If the edit mode is active, it will always be displayed.
If you want to use it, you must place the report below the Gantt logic HTLML widget. Since the report must return all rows, I would place it below the Gantt chart anyway to prevent scrolling. :)
How it works
This is where it gets really hacky.
- If the user navigates to the dashboard the fetch method is replaced with a custom fetch function. This will intercept any following request to fetch data from the server. If the user navigates away, the original fetch method is restored.
- If the target request matches the data endpoint the response handling is intercepted.
- The response is then used to render the Gantt chart
- If the report should be hidden, the returned rows are removed from the response. While the report is hidden with css, this will also prevent rendering the rows at all and therefore improve the performance.
- Return the final response so that WEBCON can handle it.
<script>
 window.fetch = async function (input, init) {
    const response = await dkr.SPAProperties.originalFetch.bind(window)(input, init);
    // 1) Restore the original fetch if the path has changed / the user has navigated away from the dashboard
    if (window.location.pathname !== dkr.SPAProperties.initialPath) {
        window.fetch = dkr.SPAProperties.originalFetch;
        dkr.SPAProperties.initialPath = null;
        return response;
    }
    const url = typeof input === 'string' ? input : input.url;
    // 2) Intercept the response of the configured report
    if (url.endsWith(`/api/db/${config.db}/app/${config.app}/report/${config.report}/data`)) {
        try {
            const clonedResponse = response.clone();
            // 3) process the response data with the Gantt chart library
            const responseData = await clonedResponse.json();
            const columnIds = dkr.gantt.getColumnIds(responseData.settings.columns);
            dkr.gantt.renderGanttChart(responseData, columnIds);

            // 4) If the report is hidden on the dashboard, clear the values to prevent further processing
            if (dkr.ganttConfig.hideReportOnDashboard) {
                responseData.values = [];
            }

            // 5) Return a new response with the modified data
            return new Response(JSON.stringify(responseData), {
                status: response.status,
                statusText: response.statusText,
                headers: response.headers
            });
        } catch (error) {
            console.error('Error processing intercepted fetch response:', error);
        }
    }
    return response;
};
</script>
While it is hacky, it allows us to:
- Let WEBCON handle the whole filtering logic
- Prevent duplicate requests to the server
Remark: One drawback ist, that modifying an element in the modal dialog will not refresh the Gantt chart. It could be done, but I haven’t implemented it.
Download
You can find the full and a minified JS version for the Gantt elements here.
Comments