Custom Gantt chart on a dashboard
Overview
Now and then there’s a question in the community how to display non absence workflows as Gantt charts. I finally had an idea how to solve this on a dashboard. While creating the solution I quickly noticed that this won’t do without an option to display a workflow instance. This gave birth to the modal dialog on a dashboard post. I think the combination of both
Implementation
The Gantt chart itself is rendered using the Frappe Gantt library. I’ve ‘just’ fetched the data and initialized the library with it. Ok, there’s also a configuration option to make it easy to use it with different reports. :) All in all, we need for this:
- A report returning the data
- A HTML code widget to configure the Gantt chart
- A HTML code widget for the Gantt logic
- A HTML code widget for the modal dashboard
- The client must be able to access
https://cdn.jsdelivr.net/npm/frappe-gantt/dist
Report
The report needs to return the data for the Gantt chart in the correct order and it must at least return:
- The workflow instance id
- Start date
- End date
- A title
It can optionally provide the following information
- Parent element
This can be the default parent workflow id, but it could also be any other column/calculated field with a workflow instance id. I saved the parent element in a choose field.

- Progress
An integer value between 0 and 100
HTML code Gantt configuration
Adding the widget
The configuration of the Gantt chart is done within JavaScript. This is added to the dashboard via an HTML code widget. It’s necessary to add this HTML code widget before any of the other HTML code widget. Those depend on it. This is also the only element you need to modify.
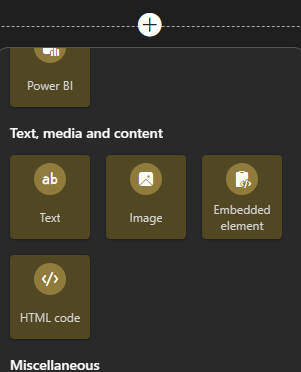
HTML code widget
You can copy the base configuration from the frappe-gantt-configuration.html file.
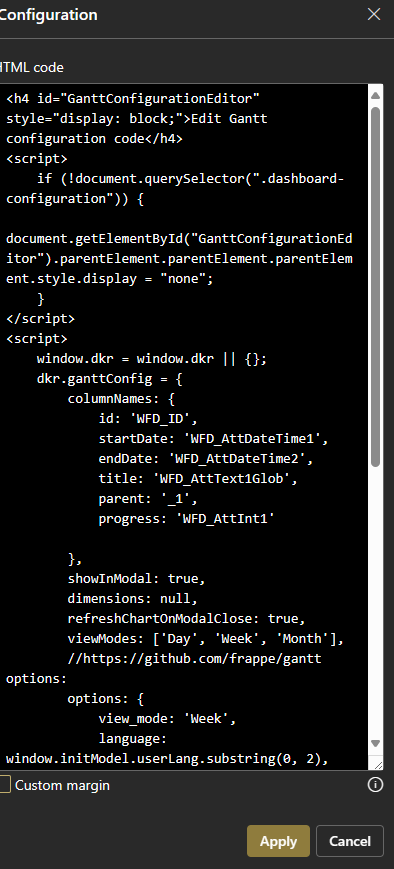
frappe-gantt-configuration.html file.
Endpoint definition
The endpoint property allows you to define different values for the dev/test/prod environment.
When fetching the data for the Gantt chart, the current hostname xyz.cosmocloud.eu will be used to get the values of the current environment.
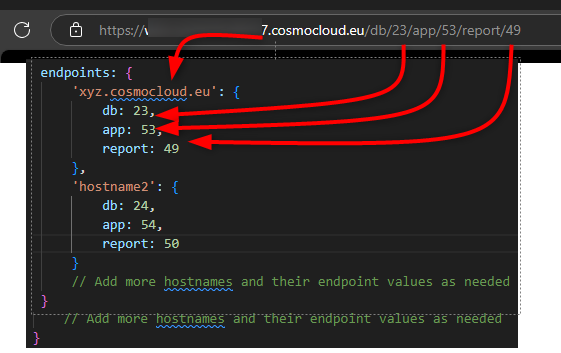
Column names
For me, the easiest way is to get the column names via the developer tools. You ‘just’ need to copy the data-key of the columns. These can then be used as the values of the column names.

On the other hand, you can also use the database column names and if you have a calculated column, use the column id with an underscore. If you are wondering why you should add an underscore, you can simply take a look at the query in the diagnostic mode:
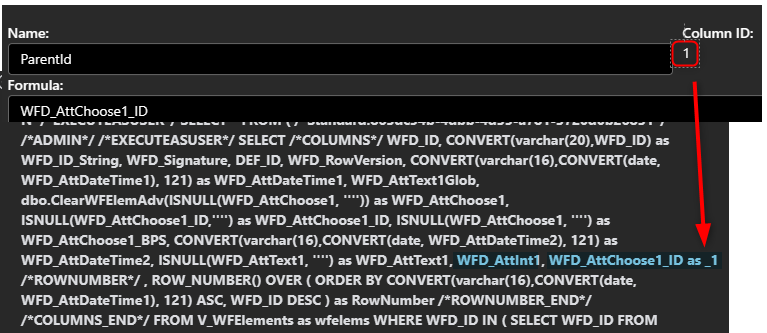
Other configuration options
Besides the already described configurations there are a few others:
- showInModal
If you set this to true, you need to add the modal dialog for dashboards to the dashboard. - dimensions
You can overwrite the default value ofheight:95%; width:95%with this setting. In case of a mobile device the default won’t be overwritten. - refreshChartOnModalClose
The default value is false. You can set this to true, but depending on the number of elements it may not be a good idea, to automatically refresh the chart when the modal is closed. - viewModes
This defines the available view modes. These are based on the default ones.
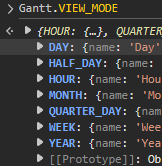
- options
These values will be passed to the Gantt library as is. You can define any of the option described on GitHub.
If you are passing other Frappe Gantt options, you must not define:
- readonly
- view_modes
- on_click
- popup
These options will be overwritten by the Gantt logic.
HTML code Gantt logic
This is straight forward, you can simply copy the frappe-gantt.html file.
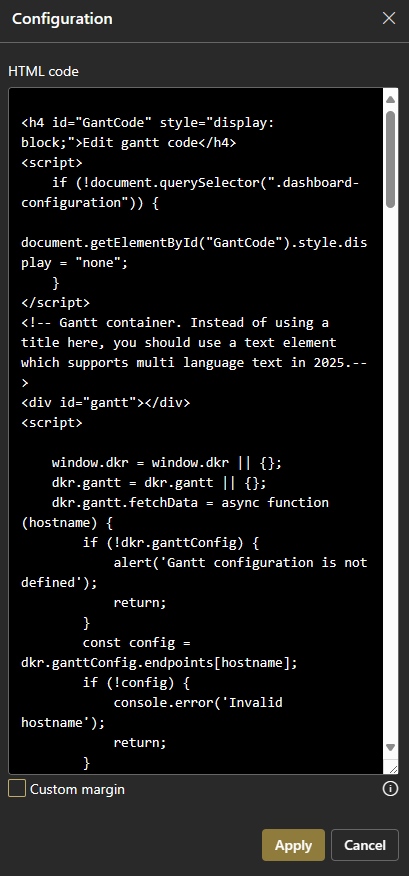
HTML codewidget.
Modal dialog
If you want to open an element in the dashboard in a modal dialog and don’t know what to do, you can refer to my previous post.
In short it is:
- Add the modal dashboard logic as another
HTML codewidget - Set the configuration value
showInModal: true - Add the child logic form rule to the workflow instance. This in turn requires the common functions/ccls.utils.
Remarks
Title of the Gantt chart
Instead of defining the title of the Gantt chart in the HTML code widget, I’ve opted for the Text widget. This allows us to define the title and other information in different languages.
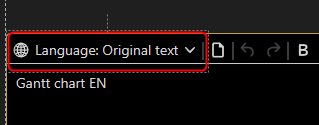
Text widget support multi language text as of 2025
Report limitations
The report defines not only data which will be displayed in the Gantt chart but also the order. There’s currently no built-in solution to handle paging. I would guess that this is not a real issue. As far as I remember, one page cannot return more than 1000 elements. If the first page of the report would include more than 1000 elements, you would have another issue altogether.
Download
You can find the full and a minified JS version for the Gantt elements here.
Comments